 |
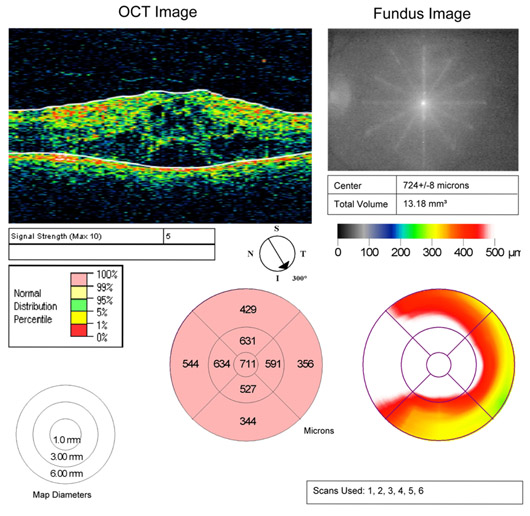
| Figure 9. Quantitative data derived from cross-sectional OCT images. The retinal thickness values and pseudo-color retinal map provide quantitative diagnostic information that is often more valuable than the cross-sectional images the data is derived from. |