 |
||||
Effects of Compression in Digital Images Used for Image Analysis |
|
Alan C. Opsahl, B.S. and Mark W. Tengowski, M.S., DVM, Ph.D Digital image analysis programs, which are useful tools in the discovery of new drugs and in industrial photography in general, can be applied to digital images to produce quantitative data that was not readily available before. Researchers and digital imaging professionals working in any scientific discipline need to be aware that artifacts can be introduced when choosing to use compression. Compressing image files can affect both subjective image quality as well as measurements extracted with image analysis programs. We were interested in the effects of compression in digital photomicrographs of rat liver tissues, using the JPEG compression component of Adobe Photoshop and Media Cybernetics Image-Pro Plus, comparing image analysis values to a TIFF uncompressed image as the gold standard. Subjective inspection and image analysis data suggest that the two compression strengths, Adobe Photoshop 0 and Image-Pro Plus 85%, produced equivalent image quality and quantitative values to TIFF uncompressed values for nuclei counts, mean percentage nuclear area, and mean nuclear area. However, using a stronger compression strength within Image-Pro Plus (90%, 95%, 100%) resulted in poorer image quality and significantly different values from TIFF uncompressed measurements. While compression does reduce file storage needs, a systematic approach should be used to determine the point when compression artifacts begin to compromise quantitative assessment.
|
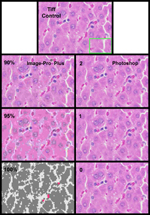
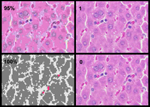
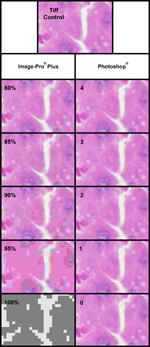
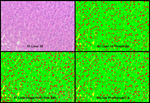
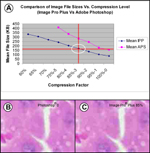
Introduction Most images used for scientific research today are created digitally. The advances in digital image capture provide many benefits over traditional photographic methods (film); speed of acquisition, ease of storage and organization, speed of processing and output, ease of image correction and plate combinations, and the use of quantification methods and measurements. This latter benefit provides the research photographer with a powerful tool that can be used in his/her research. Images have traditionally been used as references to projects or included as supplemental or illustrative information to reports. Now, since the images are digital, image analysis programs can be applied to these images to produce quantitative data that was not available before. The image itself becomes part of the data to be analyzed. How digital images are captured and saved can have an effect on the measurement output from those images. Digital images need to be saved into a digital file format. Pressure for smaller file sizes has lead to the creation of compression file formats. Instead of saving every piece of pixel information, these file formats create algorithms that take advantage of similarities of pixels within the image. These algorithms are saved and used to recreate the image when re-opened. The algorithms do, however, change pixel values from what was originally captured in the image. The changes that occur, based on the level of compression, may range from having little to significant impact on the visual appearance of an image. For readers interested in learning more about the history of image file formats and algorithm development, this information has been reviewed by Wiggins et al (2001). An upright BX-60 Olympus microscope with Sony DKC-ST5 digital camera was used to capture images of the H&E stained rat liver tissues. All images were acquired using a 20X UPlanApo lens (NA = 0.7) at a 0.56 condenser setting. Image-Pro Plus (Image-Pro Plus, v. 4.5.0.19) was used to perform the feature extractions. Calibration creation is important to provide accurate, comparable, and understandable measurements. Calibration files used within Image-Pro Plus were created using an Olympus stage micrometer (OB-M, 10 m). This permits the transformation of pixel information into dimensional measurements using a known standard. This is a common industrial practice used to display image information in measurement form rather than pixel form. At 20X, the digital field of view was (X) 427.2 μ x (Y) 328.9 μ over the pixel array, with approximately six pixels per micron. The Sony DKC-ST5 camera driver was controlled with Image-Pro Plus. The camera software automatically determined image exposure. Images were captured and transferred into Image-Pro Plus, where the appropriate 20X calibration was applied. Each image was white balanced and background corrected. The image used for background correction was an area devoid of grid or liver tissue, but that still contained PerMount medium and glass. Background correction, instead of background subtraction, is the preferred method when optical density via transmitted light is to be measured. All images files were stored to a network server and archived to CD optical medium. Each liver image (n=5 per group) was saved as a TIFF uncompressed file, with a 15.377 MB file size (2048x2560 pixel array, 24-bit true-color RGB depth). To prevent the potential for re-compression artifact, each original TIFF file was opened and had its file attributes changed to read-only. Subsequent files saved with different JPEG quality settings within each program resulted in file size ranging from approximately 100-400 kB (Figure 3). Compression strengths from Image-Pro Plus between 60% and 100%, in steps of 5 were saved as above, as were images from Photoshop using sequential compression strengths from 6 to 0. Image-Pro Plus uses an integer scale for setting the JPEG compression quality, with 100 being the smallest file and maximum compression and 1 being the largest file and least compression. Photoshop (v. 7.0.1, JPEG format baseline) utilized a qualitative compression sliding scale, with 0 being the smallest file with maximum compression and a setting of 12 being the largest file with the least compression. Image AnalysisH&E stained rat liver tissue images were used to create a color-cube based threshold, which ultimately segmented the image into nuclei, sinusoidal space, and cytoplasm regions. The threshold was created as follows: Pixels were binned into three classes based on staining intensity identifying the cell nucleus, hepatocyte cytoplasm, and sinusoidal space. Since each pixel is defined by their intensities in red, green, and blue channels, it is possible to select pixels into three classes based on sensitivity. The created color threshold was stored and applied to each image, producing the final counts. Each segment range-class had the following measurements: number of objects, total area (microns2), percent area, mean area, and standard deviation (area). Data measurements in Image-Pro Plus were exported as described above to a Microsoft Excel™ spreadsheet for simple statistics. For each image compression grouping, the mean, standard deviation, and standard error of the mean was calculated. Comparisons were performed using a Student’s t-test analysis to determine if there was any significant difference between TIFF uncompressed values and their relative concordance to the various JPEG values. A p-value below 0.05 was considered a significant difference. While Image-Pro Plus and Photoshop contain JPEG compression options for saving images, the user-defined variable level you select can impact image quality when viewed on screen and subsequent image analysis. In an on-screen representation of rat liver images captured with a 20X objective Figures 1 and 1A demonstrate that compression settings used in Image-Pro Plus, especially at high compression strengths greater than 90%, quickly result in degraded image quality. Photoshop images, even at the highest compression strength, do not result in significant compression-induced artifacts. Image-Pro Plus compression strengths greater than 90%, on the other hand, result in increased blockiness and color channel degradation. Photoshop does not appear to display this compression artifact even at its most severe compression setting of 0. With the maximum Photoshop view setting (1600%) (Figure 2), the appearance of compression-induced artifacts becomes subjectively evident at the extreme compression strength. The impact of this observation becomes clear in the analysis of nuclei counts, mean percent area of nuclei, and mean nuclei area comparisons to TIFF uncompressed measurements (Figures 3 & 4). No difference is evident between uncompressed TIFF image measurements and compressed image measurements with compression values up to 85% with Image-Pro Plus and 0 with Photoshop. While Image-Pro Plus permits additional compression strengths greater than 85%, Image-Pro Plus 90%, Image-Pro Plus 95%, and Image-Pro Plus 100% were different in all three measurements. To begin to assimilate the effect of compression strength, image file size, and qualitative image assessment, we determined that Image-Pro Plus 85% is very similar to Photoshop 0 (Figure 5). These data begin to demonstrate that JPEG compression implementation algorithms differ between software programs, and more importantly, that it is critical to understand the impact that image compression can play in image analysis. It is up to the investigator to determine an appropriate level of compression, based on the capabilities of the JPEG implementation contained within. In a review of lossy compression in dental radiography, it has been suggested that compression can be used in clinical practice, but that the degree to which information is lost as a result of the compression ratio or level is impeded by a lack of compression software standardization (Fidler et al 2006). As pixel density in digital images increases, coupled with the explosion of the use of digital imaging methods, the ability to obtain a balance between image quality and storage requirements will be an ongoing struggle. With our industrial standard operating procedures and in a regulatory environment, we may not be allowed to discard or delete study data. We continually battle the costs associated with storage; even though the costs of storage are coming down, the increased use of image analysis in a regulated environment only strengthens the case for using image compression. Our data also suggests that the use of extreme compression, even if it does not impact numerical calculation, begins to affect image quality such that the compressed version may not accurately represent the true information (e.g. TIFF gold standard). Our qualitative observation that increasing compression strength results in a perceptible loss in image integrity is supported by similar observations in digital chest images. Comparing trans-illuminated and cathode ray tube read full-size chest radiographs at clinical reading distances, Slone et al (2003) used multiple JPEG compression strengths rating the images as "indistinguishable from the original" or "degraded" at clinical reading distance, and at close inspection. Our data shows similar qualitative image degradation with increasing compression strength, and using the maximum compression setting within Image-Pro Plus resulted in un-interpretable images (e.g. Image-Pro Plus 100%). Do they mean Photoshop 10? This does not occur in Photoshop, even at maximum compression (e.g. Photoshop 0). Furthermore the most severe compression strength of Photoshop 0, does not result in a quantitative measurement difference compared with a TIFF uncompressed image. At Photoshop 0, image integrity is maintained, and for the simple rat liver analysis presented here, could be used with high confidence in image analysis studies. These new tools will need to be evaluated in a similar manner to the methods described here in order to understand their shortcomings. The pixel level detail of the compression artifact is most evident in Figure 2. The qualitative and quantitative vendor equivalent is Image-Pro Plus 85% and Photoshop 0 (Figure 3). Where this point becomes important is in multi-center works, where the possibilities for different image capture protocols reside. The awareness of the source of the image error (e.g. microscope, camera, optics, biologic variability) and how much error is permissible per experimental unit is important in the design and execution of drug development studies. For some investigations, a multi-site design is the most efficient way to deliver timely data; however, disparate image quality could have a negative effect on the overall trial. Image compression can be implemented as an acceptable practice for morphometry studies that produce many digital images, provided an understanding of the trade-offs are investigated. Compressing digital image files should reduce the image storage demands that will accumulate over time. Maximum compression may differ between vendors. In our example, Image-Pro Plus 90% or greater produced enough compression artifact to produce different image analysis measurements. Photoshop 0, which is the maximum compression allowable in this application, was not different throughout the analysis. Depending on the features to be extracted, color depth integrity as part of the thresholding will in most cases be different than that presented here, stressing the importance of pre-testing. Therefore, it is up to the imaging scientist to evaluate an acceptable level of compression and include that detail as part of the analysis protocol. Conclusion We demonstrated here, using digital photomicrographs of rat liver tissues, that compression itself results in a degradation of image quality, yet the integrity of the image analysis data is not different until extreme compression strengths are used, and only within Image-Pro 2 Plus analysis software. Researchers hoping to achieve the benefits of compressions (e.g. reduced file size and storage costs) should perform similar tests using their image data to understand when subjective and objective errors are introduced. This knowledge can be applied today in the legal and regulatory environments, where the acceptance of digital data as a matter of official record may be met with some resistance. As the field and practice of digital imaging expands, it becomes important that we as the end users work closely with camera manufacturers and software providers to design the best digital capture and analysis systems for use in science and industry. Fidler A, Likar B, Skaleric U. Lossy JPEG compression: easy to compress, hard to compare. Dentomaxillofac Radiol 2006;35(2):67-73. Slone RM, Muka E, Pilgram TK. Irreversible JPEG compression of digital chest radiographs for primary interpretation: assessment of visually lossless threshold. Radiology 2003;228(2):425-9. Tengowski MW. Image compression in morphometry studies requiring 21 CFR Part 11 compliance: procedure is key with TIFFs and various JPEG compression strengths. Toxicol Pathol 2004;32(2):258-63. Wiggins RH, III, Davidson HC, Harnsberger HR, Lauman JR, Goede PA. Image File Formats: Past, Present, and Future. Radiographics 2001;21(3):789-798.
Alan C. Opsahl began his career in microscopy at Kraft General Foods Research and Development Center-Glenview IL in 1987 working with ultrastructure of food ingredients. He moved into the pharmaceutical industry in 1993 working at Searle-Skokie IL, with the pre-clinical pathology group. There he managed a small digital imaging lab that supported pathology research. After Searle was purchased by Pfizer, he relocated to Pfizer Research and Development-Groton CT where he currently works in the Investigative Pathology Laboratory with interests in diabetes and oncology research. Alan has been an active member of the BCA since 1995 presenting at the Plenary Presentation at BioComm 2000 and receiving recognition in past years at the BioImages Salon. He has also placed twice in the Nikon Small World photo competition and once in the Olympus BioScapes Photo competition. Alan has a B.S. in Biology from the University of Wisconsin Eau-Claire. Email: alan.c.opsahl@pfizer.com Mark W. Tengowski began his research career at the University of Wisconsin-Madison in 1992 with an interest in molecular mechanisms of bovine fertilization, and joined Pfizer Central Research in 1999 concentrating on novel imaging methods for drug safety risk management. His role within Global Research & Development is in optical and non-invasive imaging methods for use in developing new osteoarthritis and rheumatoid arthritis therapeutics. Dr. Tengowski received a DVM in 1992, a MS in Veterinary Science in 1994, and a PhD in Endocrinology and Reproductive Physiology in 1997, all from the University of Wisconsin-Madison. Email: Mark.W.Tengowski@pfizer.com Alan and Mark have worked together at Pfizer since 2004 to expand the use of digital imaging technology and computation medicine in drug development. |
Copyright
2007, The Journal of Biocommunication, All Rights Reserved
Table
of Contents for VOLUME 33, NUMBER 2